Monday 20 April 2020

New – Accelerate SAP Deployments with AWS Launch Wizard

New – Accelerate SAP Deployments with AWS Launch Wizard

Last year, we announced AWS Launch Wizard for SQL Server, which enables quick and easy deployment of high availability SQL solutions on AWS for enterprise workloads.

Today, I am excited to announce AWS Launch Wizard for SAP, a new service that is speedy, easy, flexible, secure, and cost effective for customers. This new service helps Customers to deploy SAP applications on AWS by orchestrating provision of underlying AWS resources using AWS CloudFormation and AWS Systems Manager.
Thousands of AWS customers have built and migrated their SAP workloads using AWS Quick Start and Amazon Elastic Compute Cloud (EC2), including x1x1e, and high memory instances. In addition, they also take advantage of the AWS Partner Network (APN) for SAP to find solutions that work for them. SAP Customers want well architected intuitive wizard to deploy SAP system with best use of AWS resources.
AWS Launch Wizard for SAP is designed for customers who want to deploy new SAP workloads on AWS or migrate existing on-premises SAP workloads to AWS with the following benefits:
  • Deployment efficiency: AWS Launch Wizard for SAP recommends the Amazon EC2 instances that fit your SAP workload requirements and automates the launch of AWS services for SAP systems with recommended configurations and minimum manual input. Launch Wizard helps customers achieve faster time to value for provisioning and accelerates deployment of SAP applications by 2X. Being able to quickly launch SAP environments improves the customer’s agility to support new business initiatives.
  • Prescriptive guidance: AWS Launch Wizard for SAP guides customers with correct sizing and provisioning of AWS services for SAP systems based on best practices from thousands of SAP on AWS deployments.
  • Faster learning curve: AWS Launch Wizard for SAP offers an SAP-oriented user experience for customers. It provides guided deployment steps aligned with SAP deployment patterns and uses SAP terminology which creates a familiar experience for SAP users.

AWS Launch Wizard for SAP – Getting Started

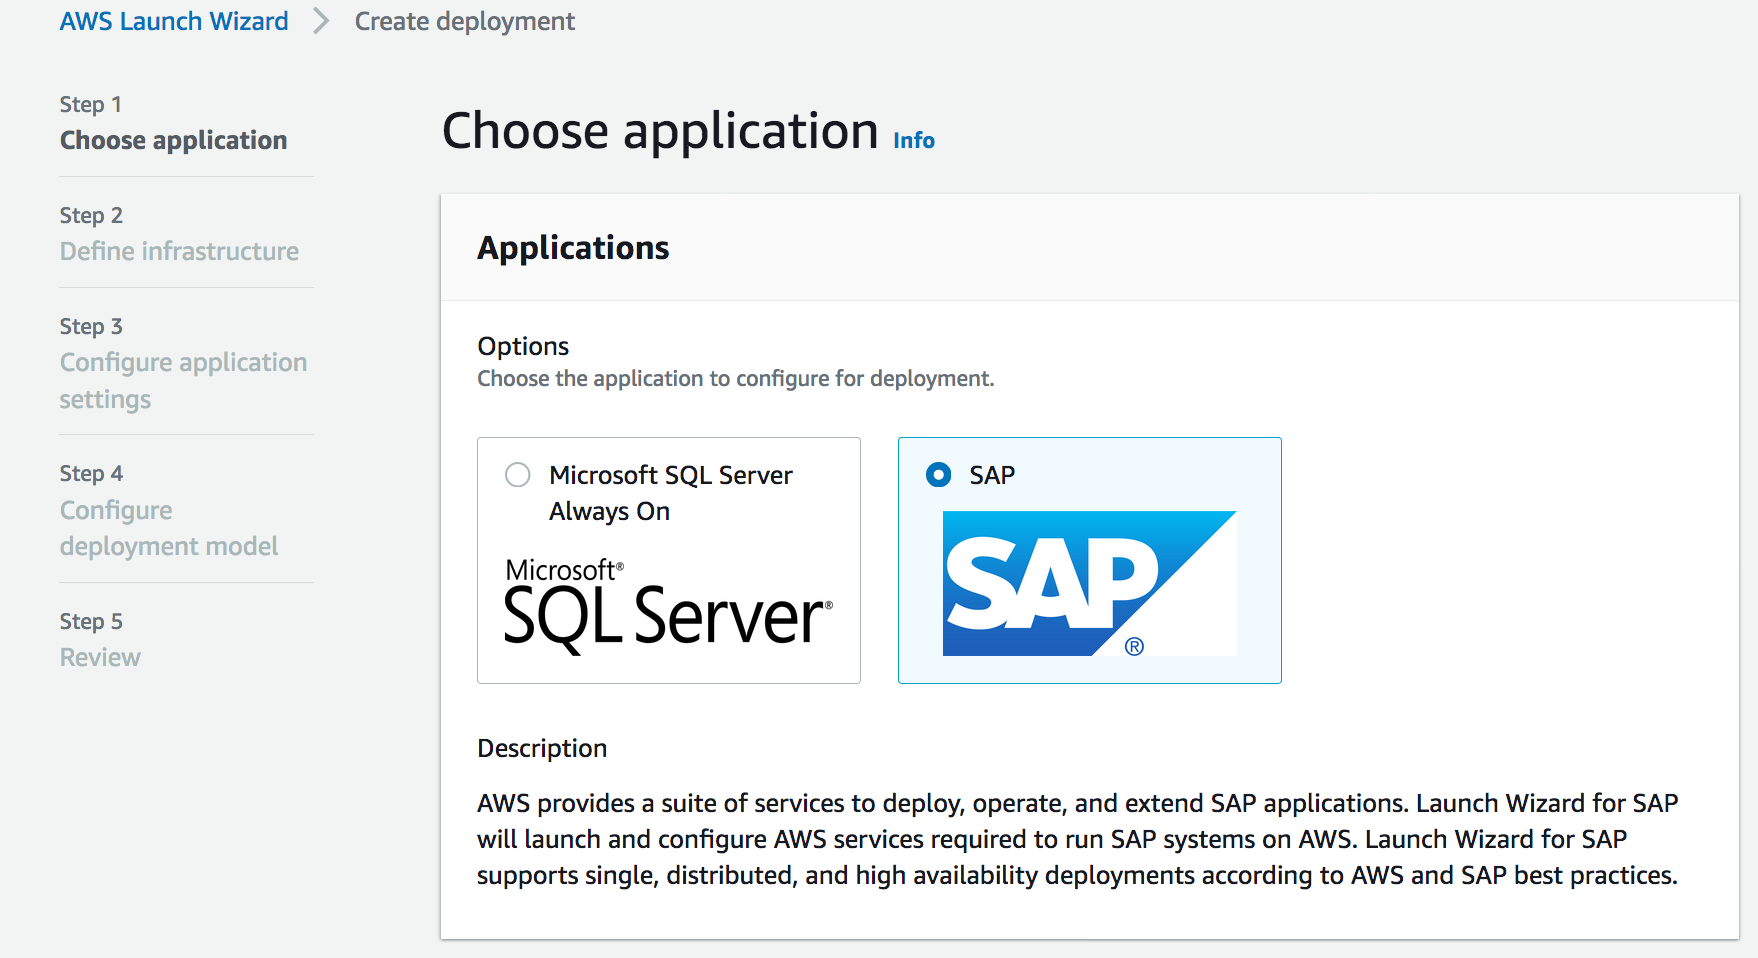
To get started with an SAP deployment, in the Launch Wizard console, you can click the Create deployment button and select the SAP application.
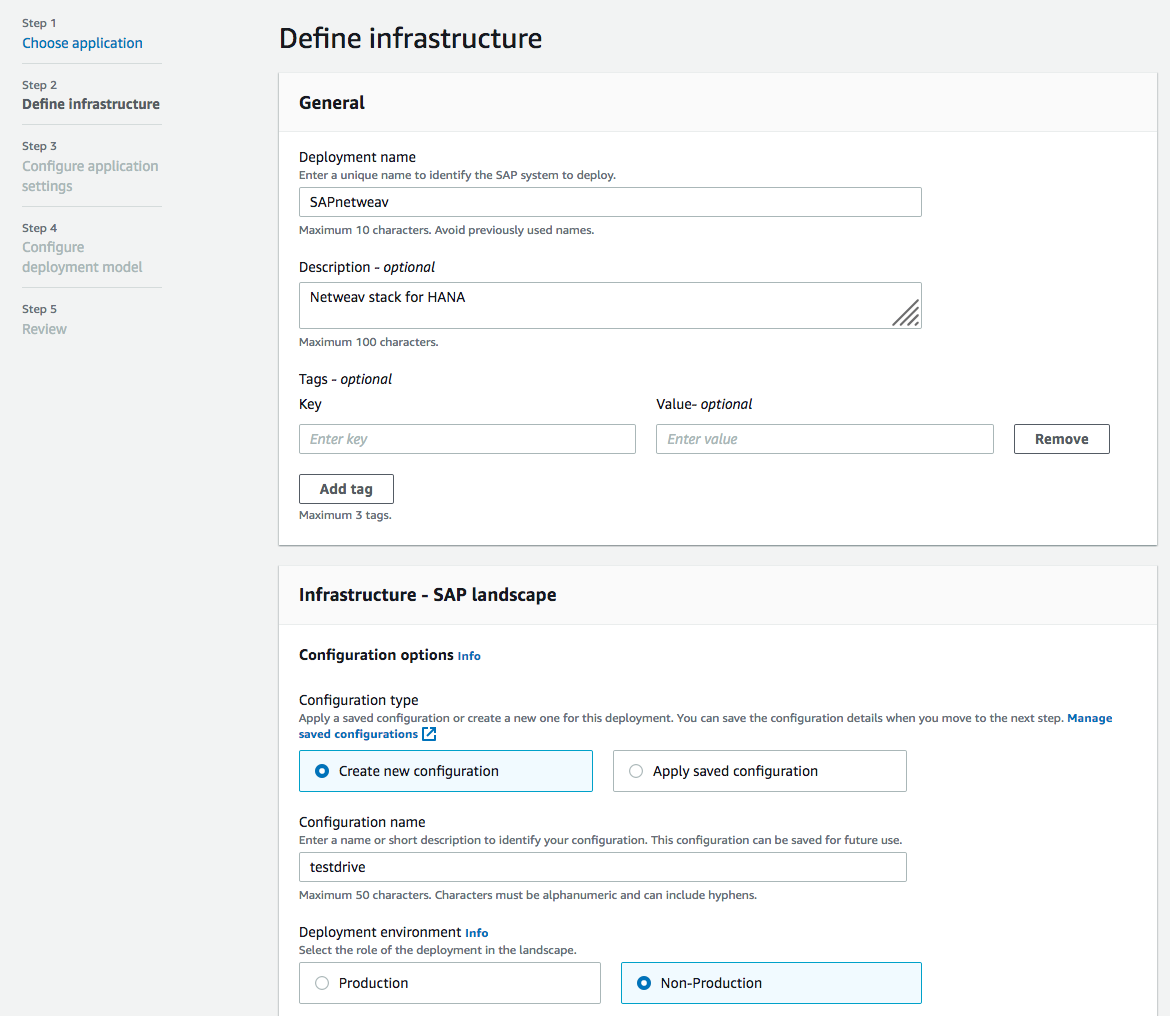
When you click on the Next button, you can provide Deployment Name and Infrastructure settings. Infrastructure settings can be saved based on how you want to classify your deployment using the infrastructure. They can be reused for SAP systems deployments that share the same infra configuration.
Assign a key pair and select the VPC which to deploy the SAP instances. After you select the Availability Zones and private subnets, you can assign security groups to the EC2 instances that will run the SAP applications.
After setting SAP System Admin IDs, you can set the topic of Amazon Simple Notification Service (SNS) to get alerts about SAP deployments. By clicking the Next button, we can go to the application settings.
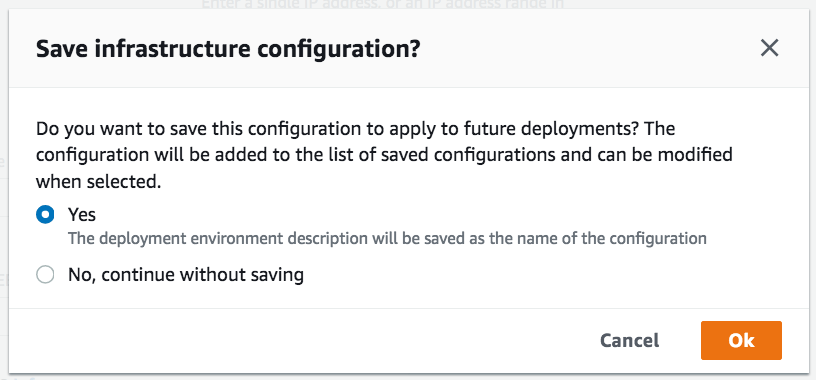
If you save infrastructure configurations, you can reuse to apply to future deployments.
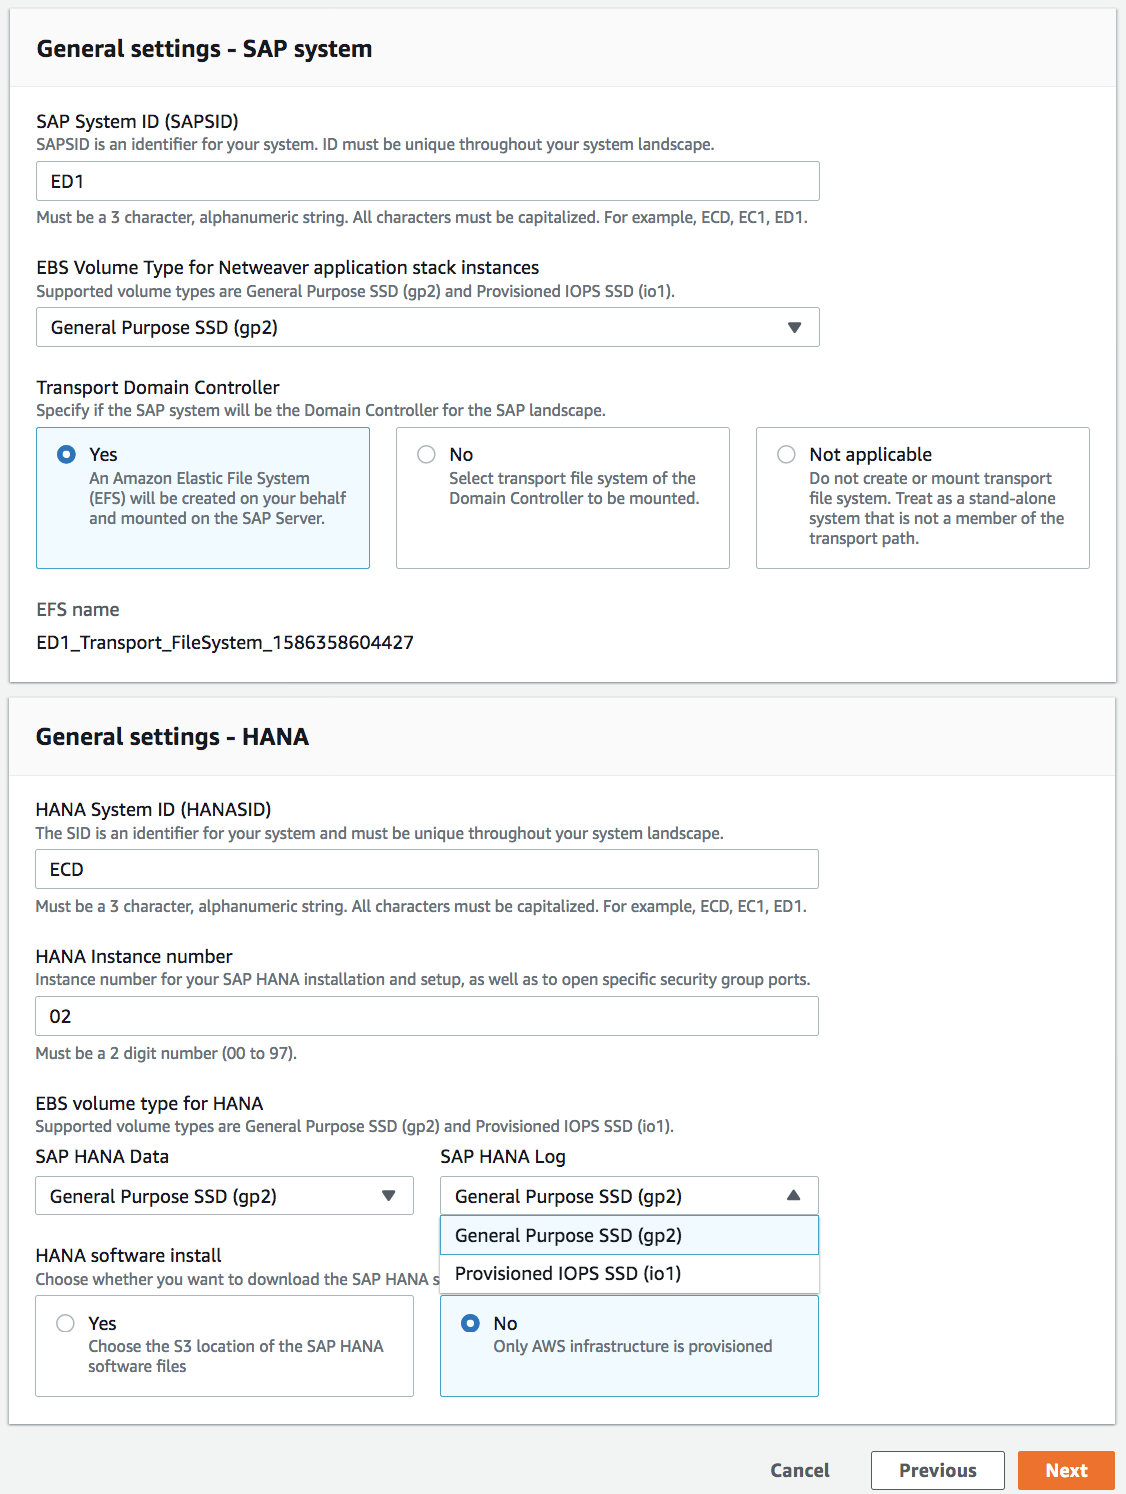
Configuring application settings, AWS Launch Wizard for SAP supports two types of SAP applications: NetWeaver stack on SAP HANA database deployments and HANA database deployments.
You can provide SAPSID, HANASID, and the instance number used in the SAP HANA installation and then configure the AWS resources based on these inputs. It supports two EBS volume types for SAP HANA Data and Log: HANA data and log – General Purpose SSD (gp2) and Provisioned IOPS SSD (io1). Optionally, a customer can choose to provide HANA software hosted on an S3 bucket to deploy HANA configured for high availability using SLES/RHE.
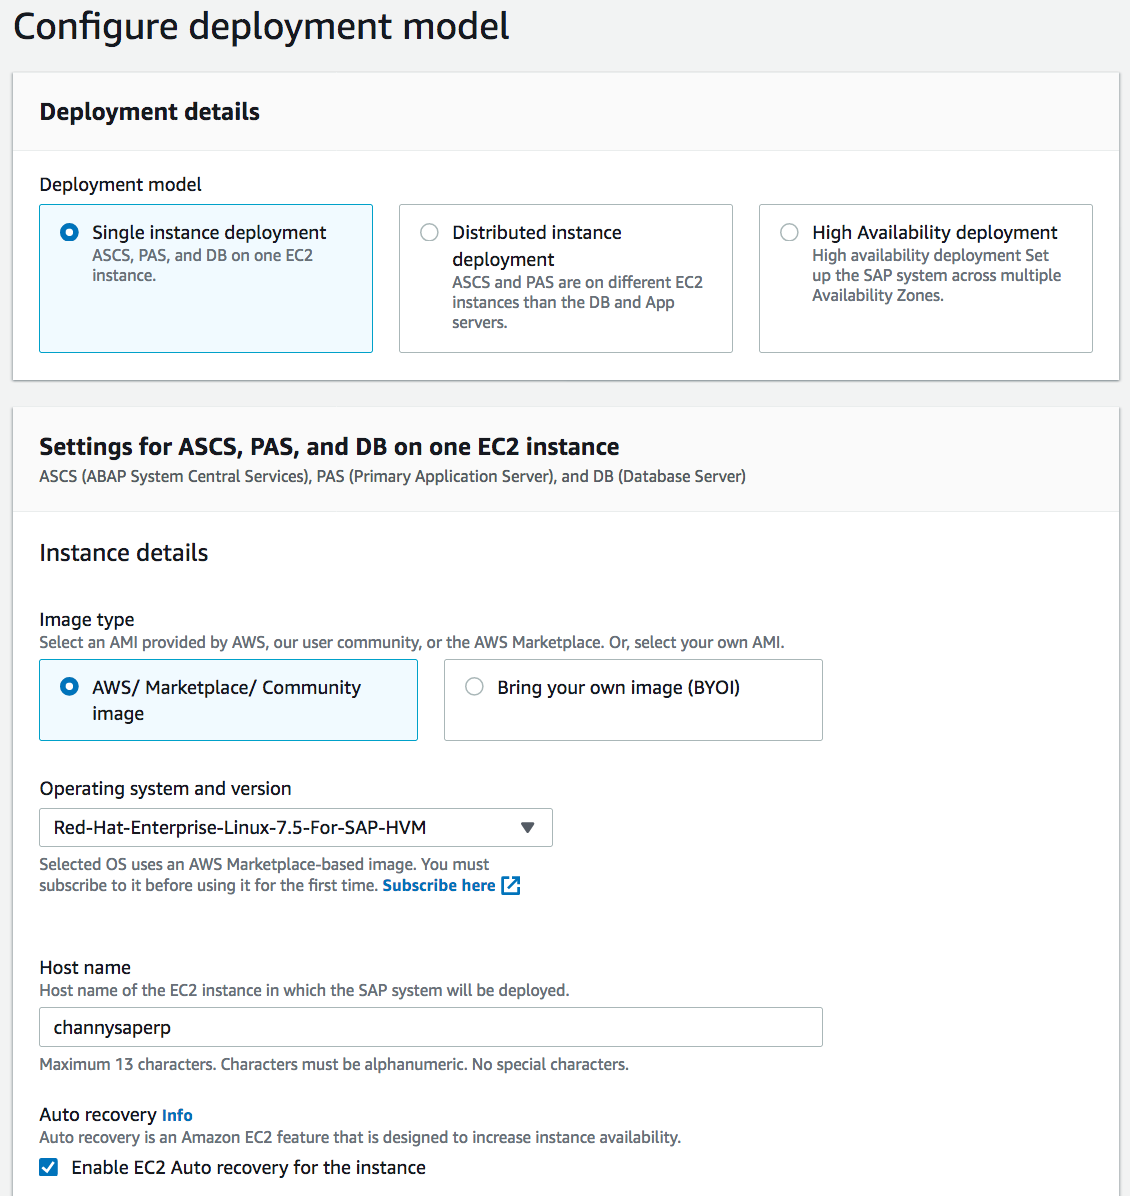
Next, you can configure the deployment model with SAP supported Operating Systems such as SUSE Linux and RedHat Enterprise within a single instance, distributed instances , and high availability patterns in multi AZs.
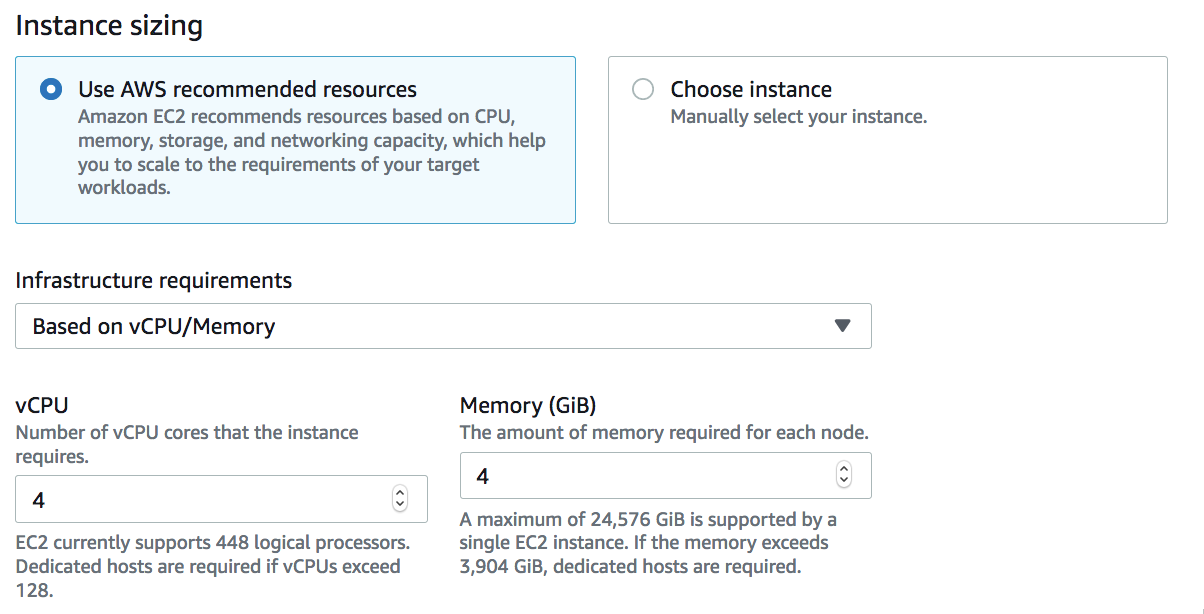
When you define the infrastructure requirement, you can use the recommended guide to provide vCPU/Memory or manually choose the instances from the list of SAP supported EC2 instances for the SAP component (ASCS or ERS or APP or HANA DB) and then deploy the SAP components on it. You will be able to see the cost estimates for the AWS resources – Amazon EC2, EBS, and EFS volumes – that will be provisioned for a particular deployment.
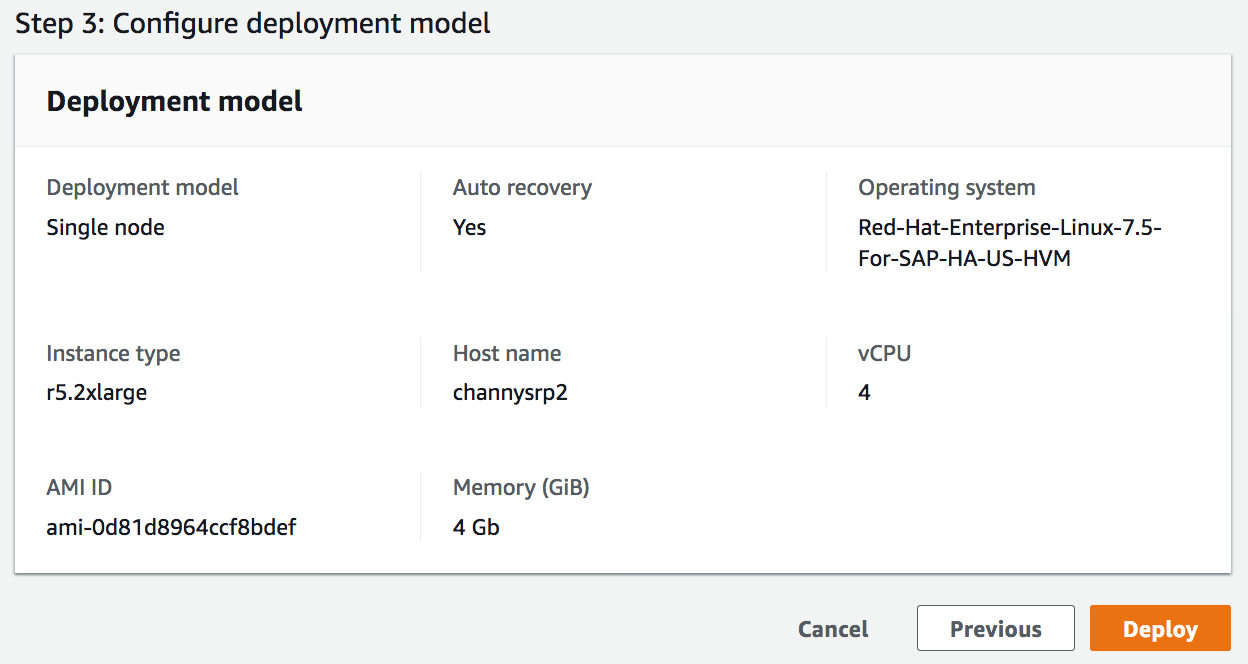
After reviewing all your configurations, you can simply deploy by clicking Deploy button.
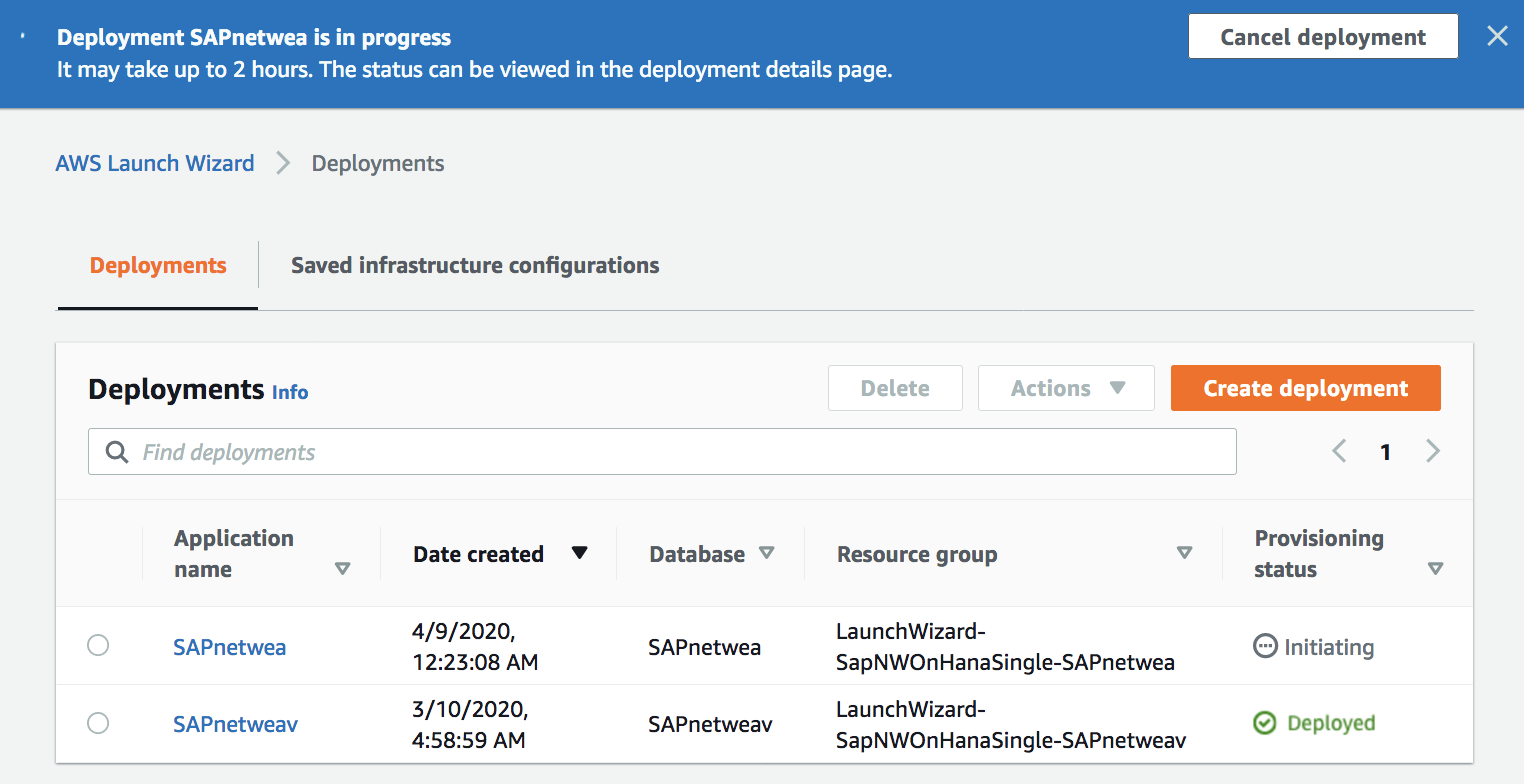
Depending on the chosen deployment it takes 1 to 3 hours. You will be able to see which SAP systems have been deployed, what infrastructure configuration was used for the deployment, what components of SAP were deployed, and a mapping of SAP components to EC2 instances.
Now Available!
AWS Launch Wizard for SAP is generally available and you can use it in US East (N. Virginia)US West (Oregon)Europe (Ireland)US West (N. California)US East (Ohio)Europe (Ireland)Europe (Paris)Europe (Frankfurt)Asia Pacific (Tokyo)Asia Pacific (Seoul)Asia Pacific (Singapore)Asia Pacific (Sydney)Asia Pacific (Mumbai)South America (São Paulo)Europe (London)Canada (Central)Europe (Stockholm). There is no additional charge for using AWS Launch Wizard, only for the resources it creates. Take a look at the product page and the documentation to learn more. Please send feedback to SAP Contact UsAWS SAP partners or through your usual AWS support contacts.
— Channy;
Channy Yun

Channy Yun

Channy Yun is a Principal Developer Advocate for AWS, and passionate about helping developers to build mod applications on latest AWS services. A pragmatic developer and blogger at heart, he loves community-driven learning and sharing of technology, which has funneled developers to global AWS Usergroups. Follow him on Twitter at @channyun.

Build more accurate forecasts with new capabilities in automated machine learning

Build more accurate forecasts with new capabilities in automated machine learning

 Senior Program Manager, Azure Machine Learning
We are excited to announce new capabilities which are apart of time-series forecasting in Azure Machine Learning service. We launched preview of forecasting in December 2018, and we have been excited with the strong customer interest. We listened to our customers and appreciate all the feedback. Your responses helped us reach this milestone. Thank you.
Featured image, general availability for Automated Machine Learning Time Series Forecasting
Building forecasts is an integral part of any business, whether it’s revenue, inventory, sales, or customer demand. Building machine learning models is time-consuming and complex with many factors to consider, such as iterating through algorithms, tuning your hyperparameters and feature engineering. These choices multiply with time series data, with additional considerations of trends, seasonality, holidays and effectively splitting training data.
Forecasting within automated machine learning (ML) now includes new capabilities that improve the accuracy and performance of our recommended models:
  • New forecast function
  • Rolling-origin cross validation
  • Configurable Lags
  • Rolling window aggregate features
  • Holiday detection and featurization

Expanded forecast function

We are introducing a new way to retrieve prediction values for the forecast task type. When dealing with time series data, several distinct scenarios arise at prediction time that require more careful consideration. For example, are you able to re-train the model for each forecast? Do you have the forecast drivers for the future? How can you forecast when you have a gap in historical data? The new forecast function can handle all these scenarios.
Let’s take a closer look at common configurations of train and prediction data scenarios, when using the new forecasting function. For automated ML the forecast origin is defined as the point when the prediction of forecast values should begin. The forecast horizon is how far out the prediction should go into the future.
In many cases training and prediction do not have any gaps in time. This is the ideal because the model is trained on the freshest available data. We recommend you set your forecast this way if your prediction interval allows time to retrain, for example in more fixed data situations such as financial forecasts rate or supply chain applications using historical revenue or known order volumes.
Ideal use case when training and prediction data have no gaps in time.
When forecasting you may know future values ahead of time. These values act as contextual information that can greatly improve the accuracy of the forecast. For example, the price of a grocery item is known weeks in advance, which strongly influences the “sales” target variable. Another example is when you are running what-if analyses, experimenting with future values of drivers like foreign exchange rates. In these scenarios the forecast interface lets you specify forecast drivers describing time periods for which you want the forecasts (Xfuture). 
If train and prediction data have a gap in time, the trained model becomes stale. For example, in high-frequency applications like IoT it is impractical to retrain the model constantly, due to high velocity of change from sensors with dependencies on other devices or external factors e.g. weather. You can provide prediction context with recent values of the target (ypast) and the drivers (Xpast) to improve the forecast. The forecast function will gracefully handle the gap, imputing values from training and prediction context where necessary.
Using contextual data to assist forecast when training and prediction data have gaps in time.
In other scenarios, such as sales, revenue, or customer retention, you may not have contextual information available for future time periods. In these cases, the forecast function supports making zero-assumption forecasts out to a “destination” time. The forecast destination is the end point of the forecast horizon. The model maximum horizon is the number of periods the model was trained to forecast and may limit the forecast horizon length.
Use case when no gap in time exists between training and prediction data and no contextual data is available.
The forecast model enriches the input data (e.g. adds holiday features) and imputes missing values. The enriched and imputed data are returned with the forecast.
Notebook examples for sales forecastbike demand and energy forecast can be found on GitHub.

Rolling-origin cross validation

Cross-validation (CV) is a vital procedure for estimating and reducing out-of-sample error for a model. For time series data we need to ensure training only occurs using values to the past of the test data. Partitioning the data without regard to time does not match how data becomes available in production, and can lead to incorrect estimates of the forecaster’s generalization error.
To ensure correct evaluation, we added rolling-origin cross validation (ROCV) as the standard method to evaluate machine learning models on time series data. It divides the series into training and validation data using an origin time point. Sliding the origin in time generates the cross-validation folds.
As an example, when we do not use ROCV, consider a hypothetical time-series containing 40 observations. Suppose the task is to train a model that forecasts the series up-to four time-points into the future. A standard 10-fold cross validation (CV) strategy is shown in the image below. The y-axis in the image delineates the CV folds that will be made while the colors distinguish training points (blue) from validation points (orange). In the 10-fold example below, notice how folds one through nine result in model training on dates future to be included the validation set resulting inaccurate training and validation results.
Cross validation showing training points spread across folds and distributed across time points causing data leakage in validation
This scenario should be avoided for time-series instead, when we use an ROCV strategy as shown below, we preserve the time series data integrity and eliminate the risk of data leakage.
Rolling-Origin Cross Validation (ROCV) showing training points distributed on each fold at the end of the time period to eliminate data leakage during validation
ROCV is used automatically for forecasting. You simply pass the training and validation data together and set the number of cross validation folds. Automated machine learning (ML) will use the time column and grain columns you have defined in your experiment to split the data in a way that respects time horizons. Automated ML will also retrain the selected model on the combined train and validation set to make use of the most recent and thus most informative data, which under the rolling-origin splitting method ends up in the validation set.

Lags and rolling window aggregates

Often the best information a forecaster can have is the recent value of the target. Creating lags and cumulative statistics of the target then increases accuracy of your predictions.
In automated ML, you can now specify target lag as a model feature. Adding lag length identifies how many rows to lag based on your time interval. For example, if you wanted to lag by two units of time, you set the lag length parameter to two.
The table below illustrates how a lag length of two would be treated. Green columns are engineered features with lags of sales by one day and two day. The blue arrows indicate how each of the lags are generated by the training data. Not a number (Nan) are created when sample data does not exist for that lag period.
Table illustrating how a lag length og two would be treated
In addition to the lags, there may be situations where you need to add rolling aggregation of data values as features. For example, when predicting energy demand you might add a rolling window feature of three days to account for thermal changes of heated spaces. The table below shows feature engineering that occurs when window aggregation is applied. Columns for minimum, maximum, and sum are generated on a sliding window of three based on the defined settings. Each row has a new calculated feature, in the case of date January 4, 2017 maximum, minimum, and sum values are calculated using temp values for January 1, 2017, January 2, 2017, and January 3, 2017. This window of “three” shifts along to populate data for the remaining rows.
Table showing feature engineering that occurs when window aggregation is applied.
Generating and using these additional features as extra contextual data helps with the accuracy of the trained model. This is all possible by adding a few parameters to your experiment settings.

Holiday features

For many time series scenarios, holidays have a strong influence on how the modeled system behaves. The time before, during, and after a holiday can modify the series’ patterns, especially in scenarios such as sales and product demand. Automated ML will create additional features as input for model training on daily datasets. Each holiday generates a window over your existing dataset that the learner can assign an effect to. With this update, we will support over 2000 holidays in over 110 countries. To use this feature, simply pass the country code as a part of the time series settings. The example below shows input data in the left table and the right table shows updated dataset with holiday featurization applied. Additional features or columns are generated that add more context when models are trained for improved accuracy.
Training data on left shows without holiday features applied, table on the right shows.

Get started with time-series forecasting in automated ML

With these new capabilities automated ML increases support more complex forecasting scenarios, provides more control to configure training data using lags and window aggregation and improves accuracy with new holiday featurization and ROCV. Azure Machine Learning aims to enable data scientists of all skill levels to use powerful machine learning technology that simplifies their processes and reduces the time spent training models. Get started by visiting our documentation and let us know what you think - we are committed to make automated ML better for you!

How Azure Machine Learning powers suggested replies in Outlook

How Azure Machine Learning powers suggested replies in Outlook

 Partner Group Program Manager, AI Platform Management
Microsoft 365 applications are so commonplace that it’s easy to overlook some of the amazing capabilities that are enabled with breakthrough technologies, including artificial intelligence (AI). Microsoft Outlook is an email client that helps you work efficiently with email, calendar, contacts, tasks, and more in a single place.
To help users be more productive and deliberate in their actions while emailing, the web version of Outlook and the Outlook for iOS and Android app have introduced suggested replies, a new feature powered by Azure Machine Learning. Now when you receive an email message that can be answered with a quick response, Outlook on the web and the Outlook mobile suggest three response options that you can use to reply with only a couple of clicks or taps, helping people communicate in both their workplace and personal life, by reducing the time and effort involved in replying to an email.
11
The developer team behind suggested replies is comprised of data scientists, designers, and machine learning engineers with diverse backgrounds who are working to improve the lives of Microsoft Outlook users by expediting and simplifying communications. They are at the forefront of applying cutting-edge natural language processing (NLP) and machine learning (ML) technologies and leverage these technologies to understand how users communicate through email and improve those interactions from a productivity standpoint to create a better experience for users.

A peek under the hood

To process the massive amount of raw data that these interactions provide, the team uses Azure Machine Learning pipelines to build their training models. Azure Machine Learning pipelines allow the team to divide training steps into discrete steps such as data cleanup, transforms, feature extraction, training, and evaluation. The output of the Azure Machine Learning pipeline converts raw data into a model. This Machine Learning pipeline allows the data scientists to build a training pipeline in a compliant manner that enforces privacy and compliance checks.
22
In order to train this model, the team needed a way to build and prepare a large data set comprised of over 100 million messages. To do this, the team leveraged a distributed processing framework to sample and retrieve data from a broad user base.
Azure Data Lake Storage is used to store the training data used for training the suggested replies models. We then clean and curate the data into message reply pairs (including potential responses to an email) that are stored in Azure Data Lake Storage (ADLS). The training pipelines also consume the reply pairs stored in ADLS in order to train models. To conduct the Machine Learning training itself, the team uses GPU pools available in Azure. The training pipelines leverage these curated Message Reply pairs to learn how to suggest appropriate replies based on a given message. Once the model is created, data scientists can compare the model performance with previous models and evaluate which approaches perform better at recommending relevant suggested replies.
The Outlook team helps protect your data by using the Azure platform to prepare large-scale data sets that are required to build a feature like suggested replies in accordance with Office 365 compliance standards. The data scientists use Azure compute and workflow solutions that enforce privacy policies to create experiments and train multiple models on GPUs. This helps with the overall developer experience and provides agility in the inner development loop cycle.
This is just one of many examples of how Microsoft products are powered by the breakthrough capabilities of Azure AI to create better user experiences. The team is learning from feedback every day and improving the feature for users while also expanding the types of suggested replies offered. Keep following the Azure blog to stay up-to-date with the team and be among the first to know when this feature is released.

Learn more

Learn more about Azure Machine Learning and how Outlook on the web uses intelligent technology

Saturday 11 April 2020

Turn your whiteboard sketches to HTML website

Turn your whiteboard sketches to working code in seconds with Sketch2Code

User interface design process involves a lot a creativity that starts on a whiteboard where designers share ideas. Once a design is drawn, it is usually captured within a photograph and manually translated into some working HTML wire frame to play within a web browser. This takes efforts and delays the design process. What if a design is refactored on the whiteboard and the browser reflects changes instantly? In that sense, by the end of the session there is a resulting prototype validated between the designer, developer, and customer. Introducing Sketch2Code, a web based solution that uses AI to transform a handwritten user interface design from a picture to a valid HTML markup code.
Sketch2Code
Let’s understand the process of transforming handwritten image to HTML using Sketch2Code in more details.
  • First the user uploads an image through the website.
  • A custom vision model predicts what HTML elements are present in the image and their location.
  • A handwritten text recognition service reads the text inside the predicted elements.
  • A layout algorithm uses the spatial information from all the bounding boxes of the predicted elements to generate a grid structure that accommodates all.
  • An HTML generation engine uses all these pieces of information to generate an HTML markup code reflecting the result.
Below is the the application workflow:
Application workflow
The Sketch2Code uses the following elements:
  • A Microsoft Custom Vision Model: This model has been trained with images of different handwritten designs tagging the information of most common HTML elements like buttons, text box, and images.
  • A Microsoft Computer Vision Service: To identify the text written into a design element a Computer Vision Service is used.
  • An Azure Blob Storage: All steps involved in the HTML generation process are stored, including the original image, prediction results and layout grouping information.
  • An Azure Function: Serves as the backend entry point that coordinates the generation process by interacting with all the services.
  • An Azure website: User font-end to enable uploading a new design and see the generated HTML results.
The above elements form the architecture as follows:
Architecture elements
You can find the code, solution development process, and all other details on GitHub. Sketch2Code is developed in collaboration with Kabel and Spike Techniques.
We hope this post helps you get started with AI and motivates you to become an AI developer.
 Sr. Technical Product Marketing Manager, Artificial Intelligence

Home Automation Ideas

  Home automation is much more than a one-trick pony. When you build on a strong foundation, such as an Solar Panel t hat powers your whole ...